Energy Fluxes
Mean patterns of Energy Fluxes
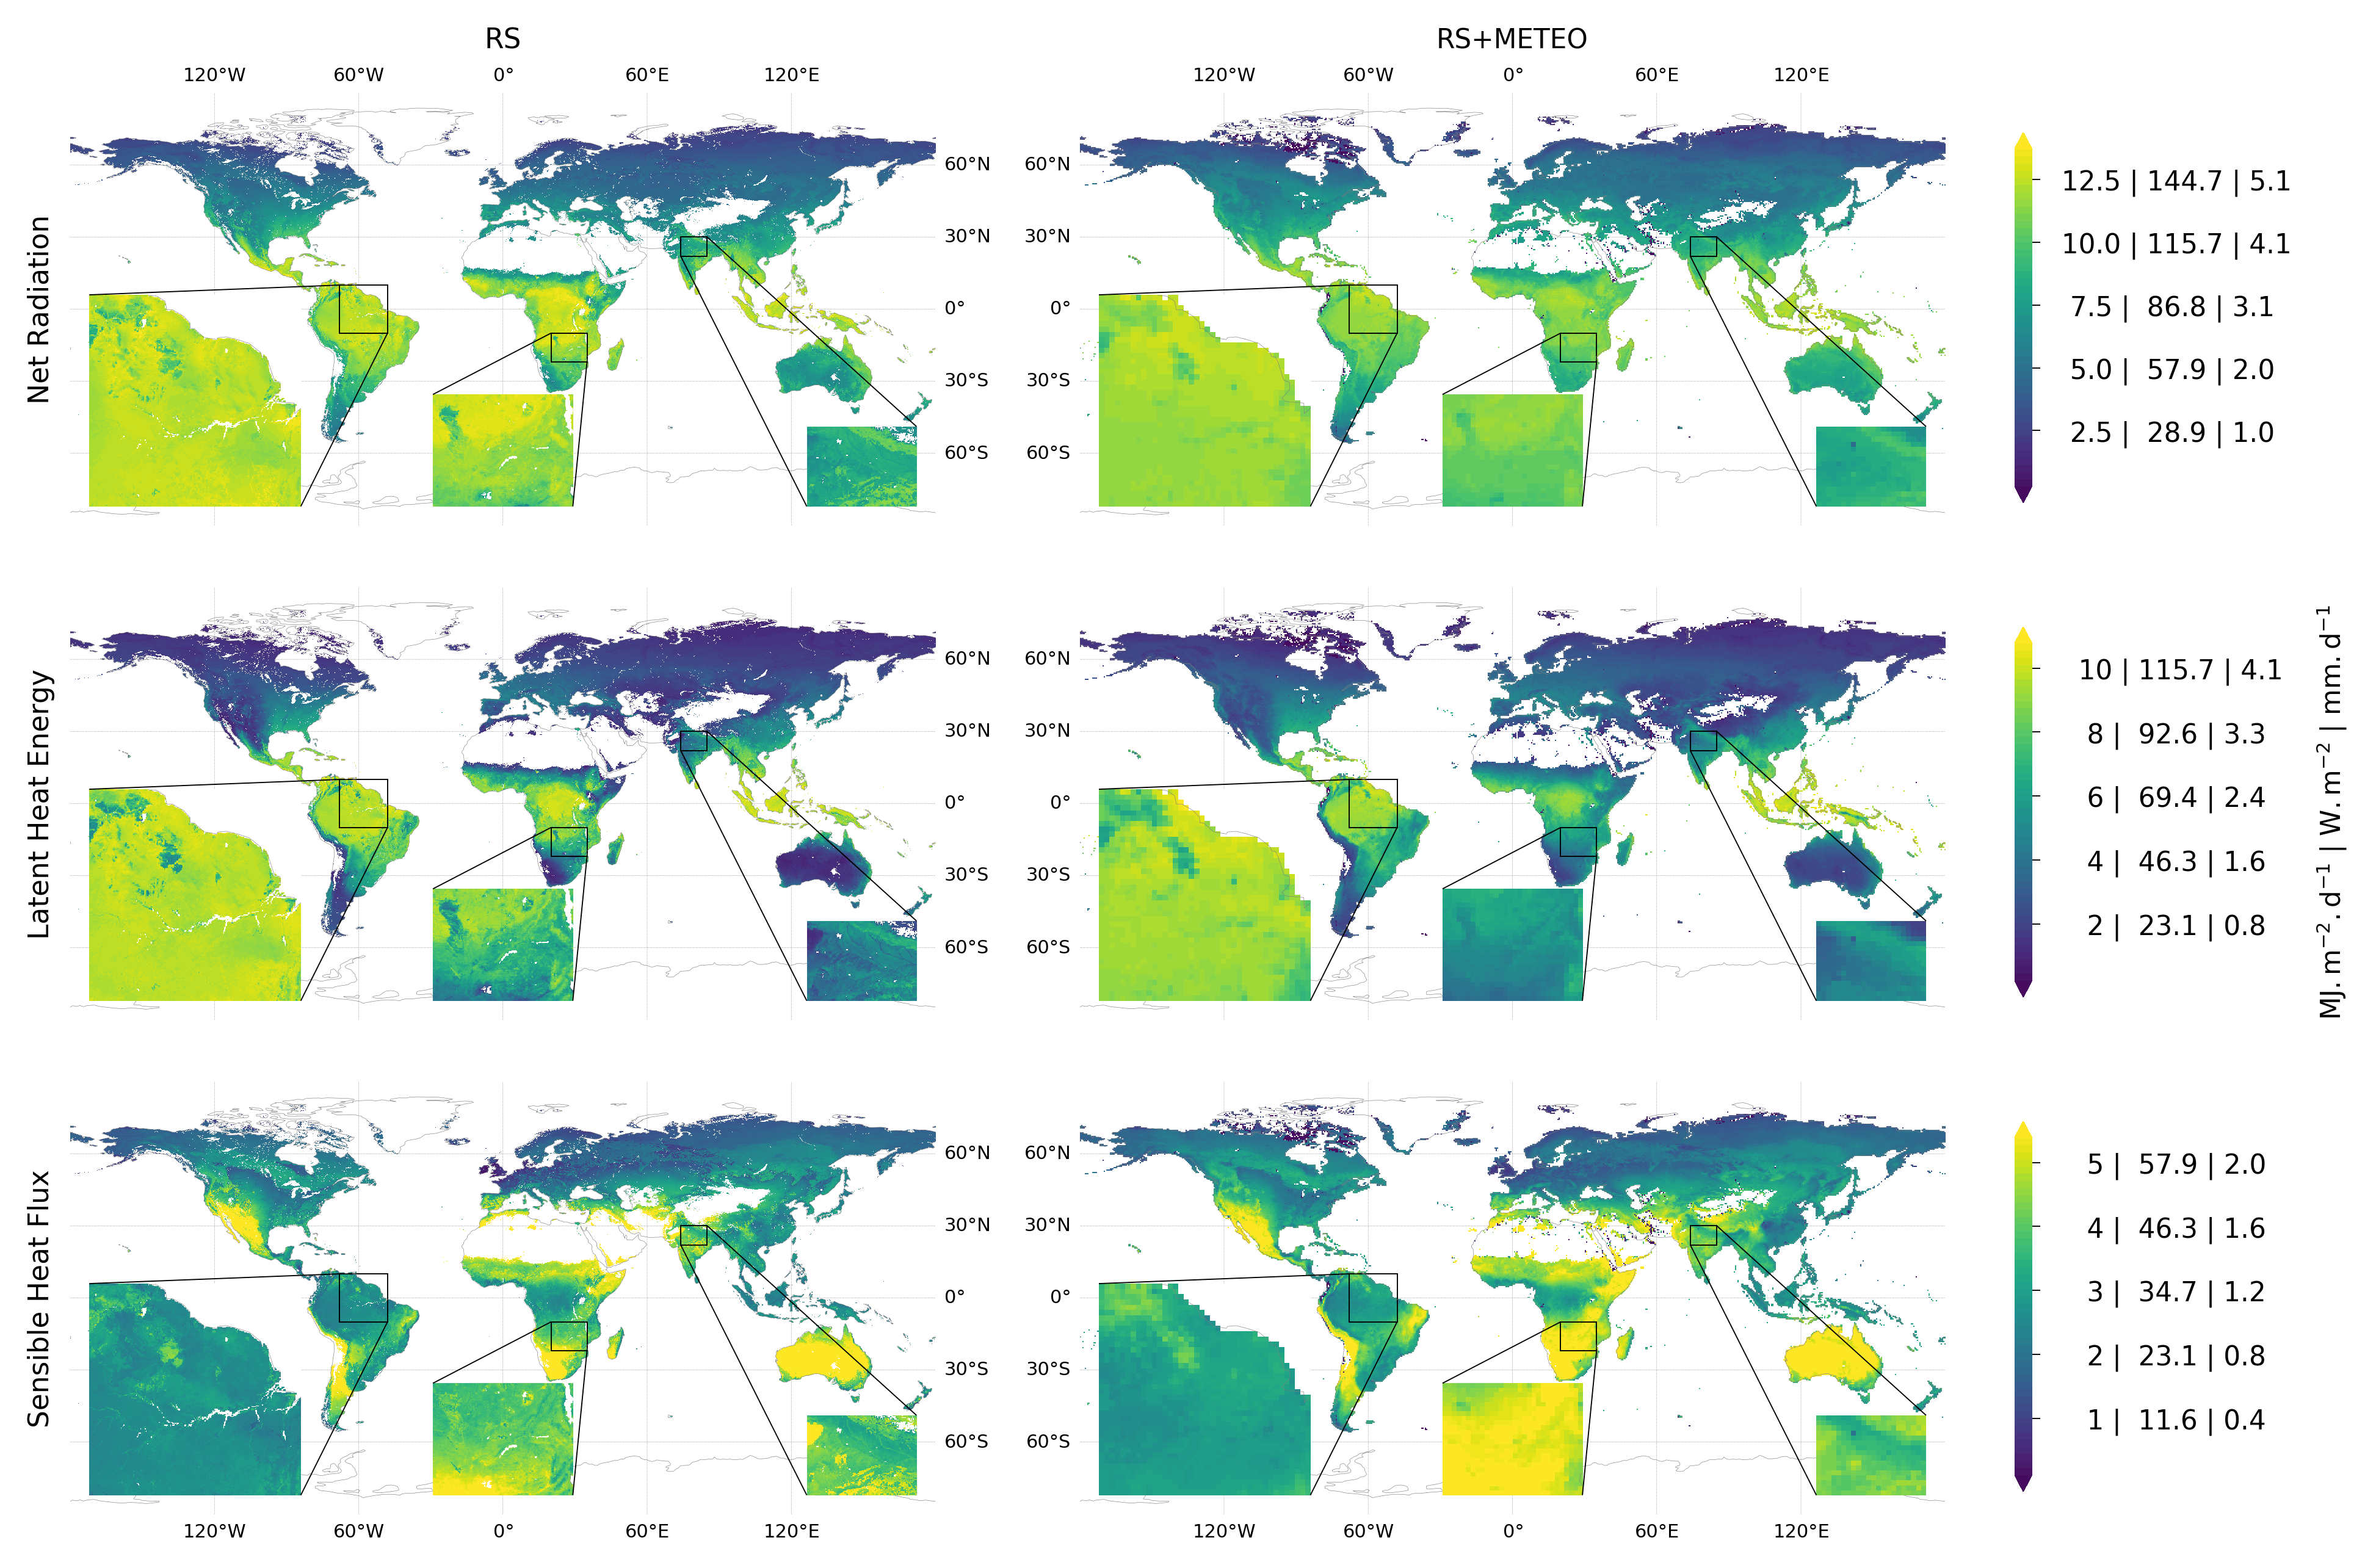
Global distributions of mean annual (2001-2013) energy fluxes from the FLUXCOM RS and RS+METEO ensembles. The first, second, and third row show net radiation, latent heat, and sensible heat fluxes, respectively (left: RS, right: RS+METEO).
Consistent with current understanding, mean annual latent heat and net radiation fluxes are the highest in tropical and the lowest in high latitude regions of the world (Figure 2). In contrast, mean annual sensible heat peaks in dry sub-tropical regions where latent heat fluxes are reduced due to expected water limitation on evapotranspiration which is known to increase the Bowen ratio (H/LE). These patterns are qualitatively consistent among the RS and RS+METEO ensemble products, while flux magnitude differences, e.g. larger net radiation of the RS product in the tropics, are also evident. In general, both RS and RS+METEO products show similar large-scale variations in energy fluxes but local-scale heterogeneities are better resolved in RS products (see the inset zoom-ins in Figure 2) due to a 6-fold increase in spatial resolution.
Evaporative Fraction
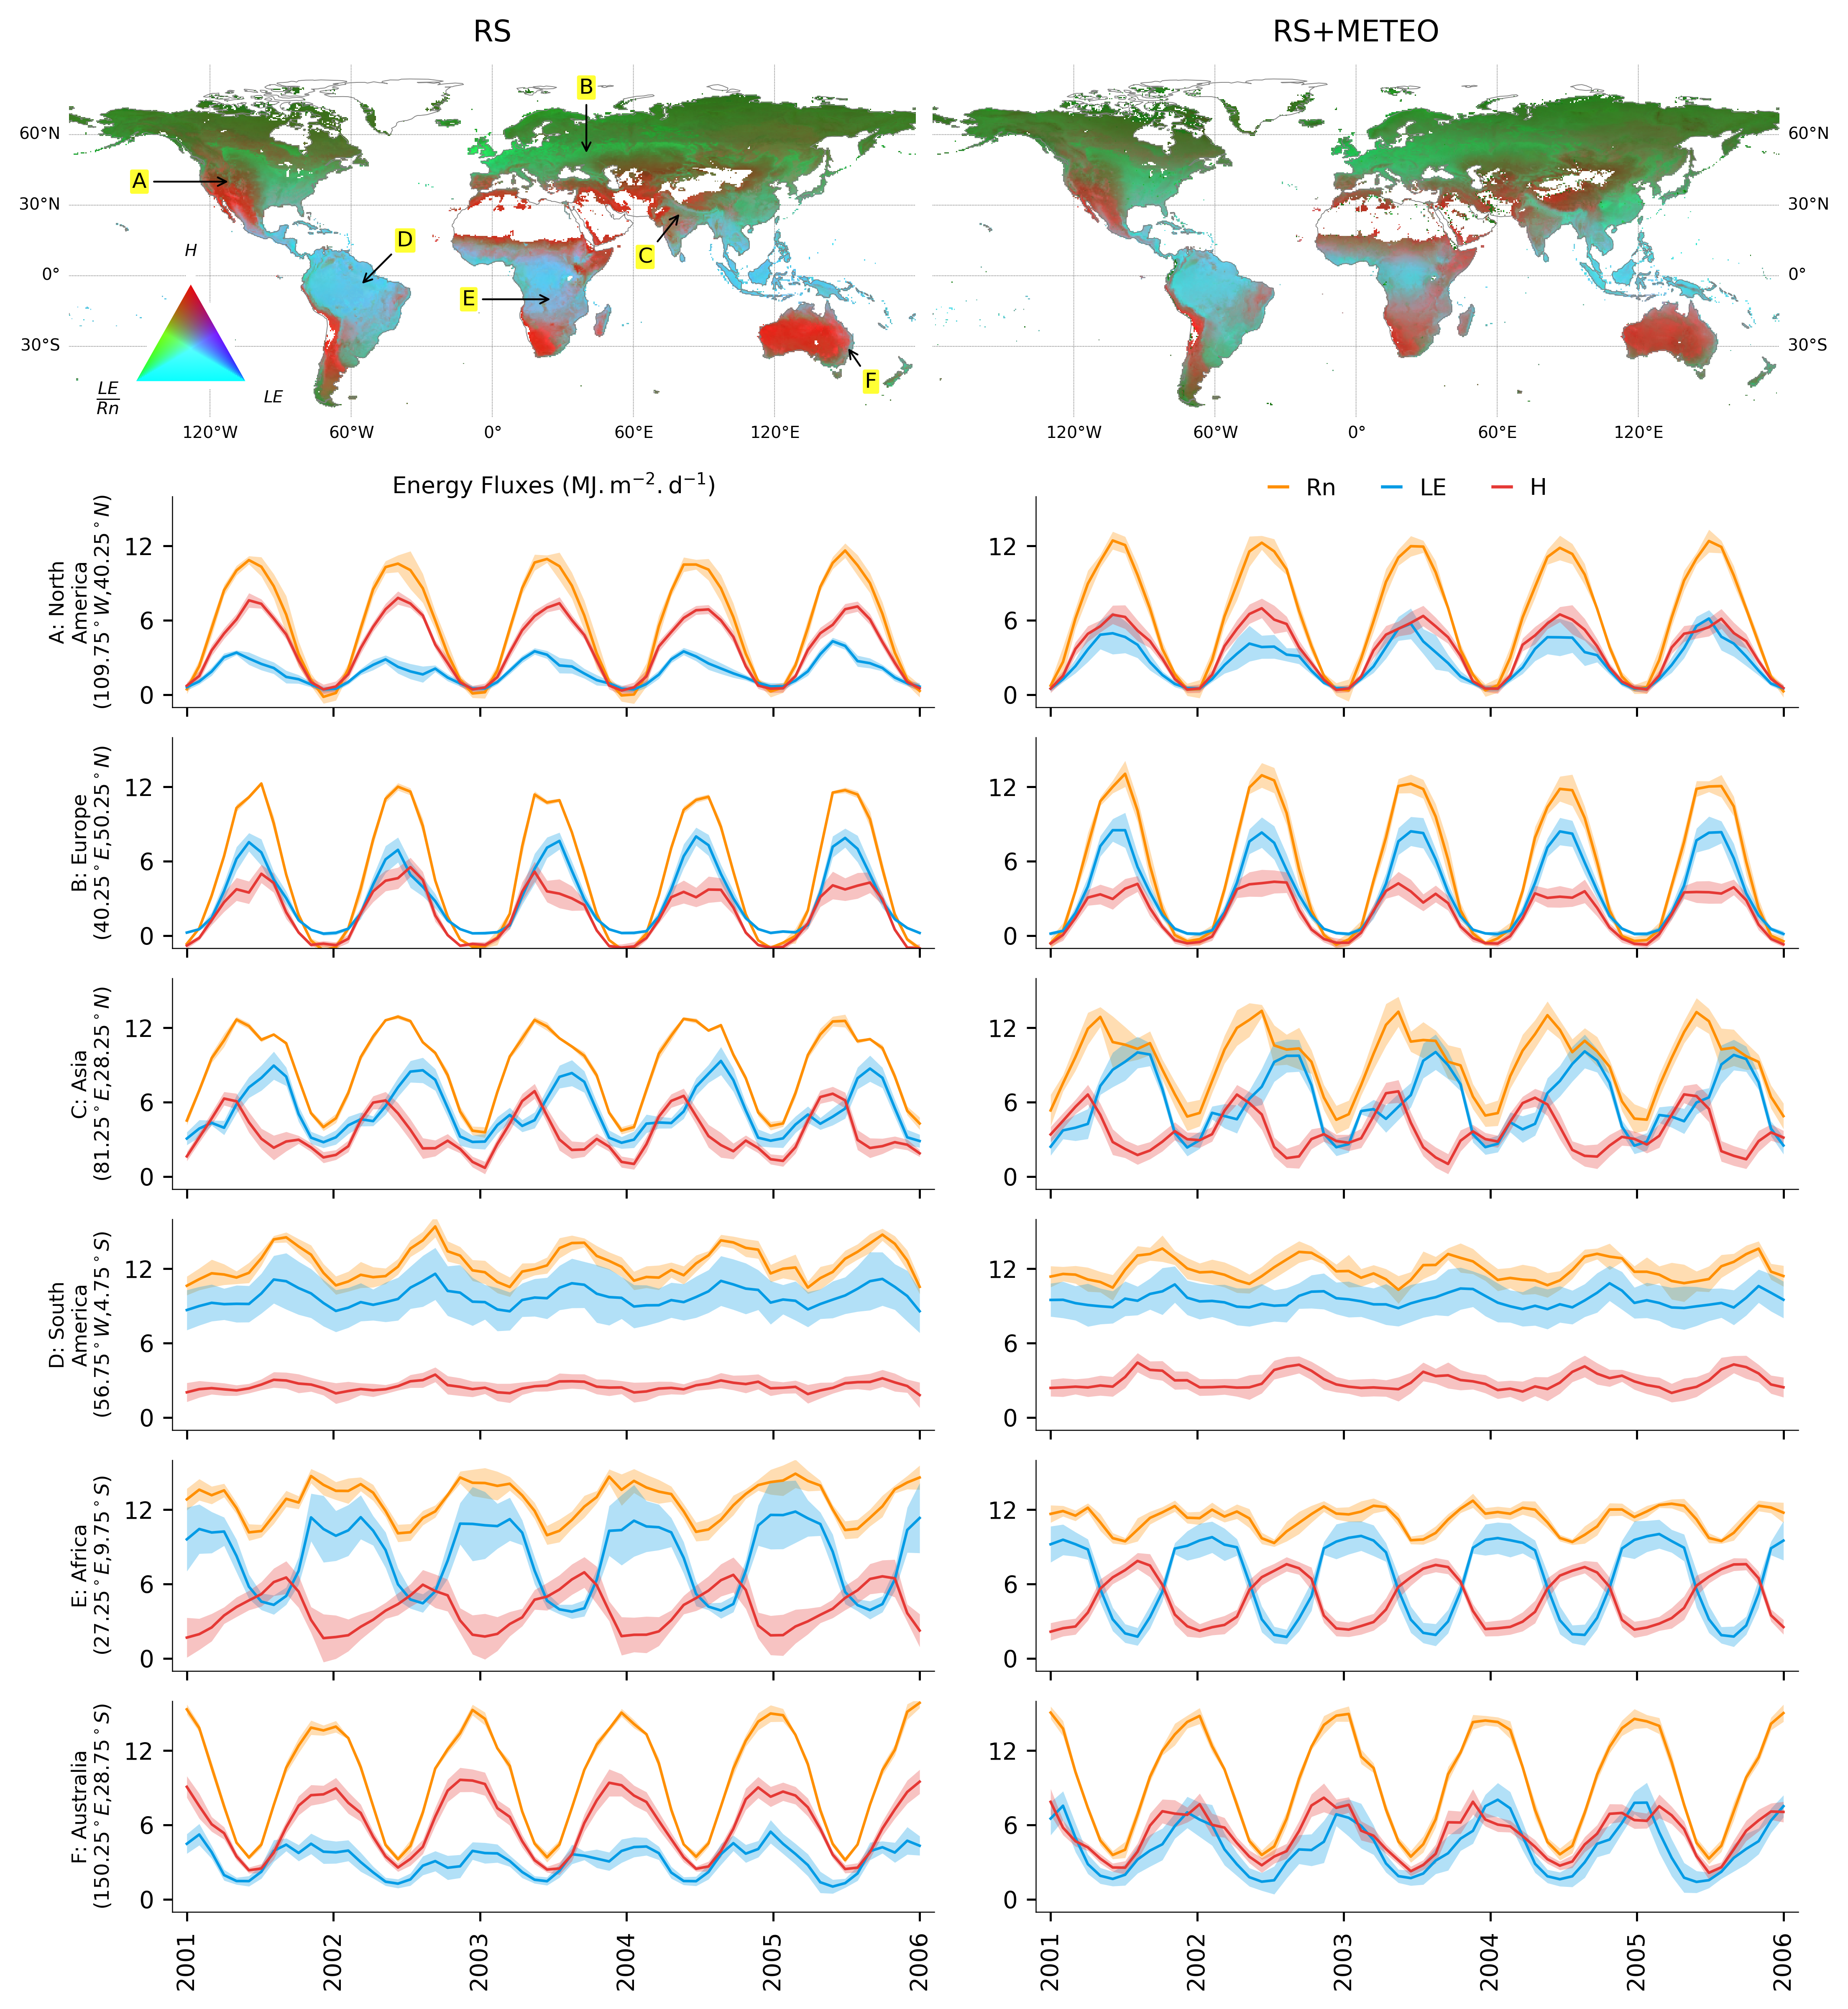
Global covariations of land-atmosphere energy fluxes, and their temporal variations and uncertainties in selected locations. RGB composite maps are with latent heat (LE) in the blue, sensible heat flux (H) in the red, and evaporative fraction (LE/Rn) in the green channel. Line plots show time series of LE (blue), H (red), and Rn (orange) for selected locations (0.5° grid cells, see map for RS) from 2001 to 2005 in MJ m-2 d-1. The shades around the lines indicate the uncertainty ranges (± 1 robust standard deviation) of ensemble members.
In these RGB maps, hot and dry regions appear as red where latent heat is low and net radiation is preferentially converted to sensible heat. Wet tropical regions with high net radiation and latent heat but low sensible heat appear as cyan. Regions where latent heat is energy limited but net radiation is intermediate or low appear in green. The partitioning of Rn into LE and H components is similar for both RS+METEO and RS products (Figure 3) with some regional differences visible. To illustrate local differences among the RS and RS+METEO ensemble products, as well as seasonal variations of energy fluxes and its uncertainties, we present time series of selected locations (0.5° grid cells) in subpanels of Figure 3. For example, in the selected location in North America (A), situated at the transition between water limited and energy limited regime of evapotranspiration, we see more H relative to LE in the RS ensemble compared to the RS+METEO ensemble. Similar patterns of slightly different net radiation partitioning in LE and H are also evident in other transitional locations in Africa (E) and Australia (F). Energy flux uncertainties (see shading in Figure 3) vary spatially, seasonally, and interannually as well as between the RS and the RS+METEO ensemble products. Where uncertainties of the RS+METEO ensemble are larger compared to the RS ensemble suggests larger contributions of meteorological forcing data uncertainty, while larger uncertainty of the RS ensemble may indicate larger contribution of machine learning method choice, perhaps due to poor constraints by flux tower stations. Overall, there is high level of consistency between the RS and RS+METEO ensemble products for seasonality and flux magnitudes as well as their uncertainties.
Carbon Fluxes
Currently, in analysis....